Drone Flight Report / Sample Drone Flight Report
Sample Drone Flight Report
Every report follows the same structure, whether the source is a DJI CSV, an ArduPilot .bin or a PX4 .ulg. The example below is generated from a synthetic demo flight.
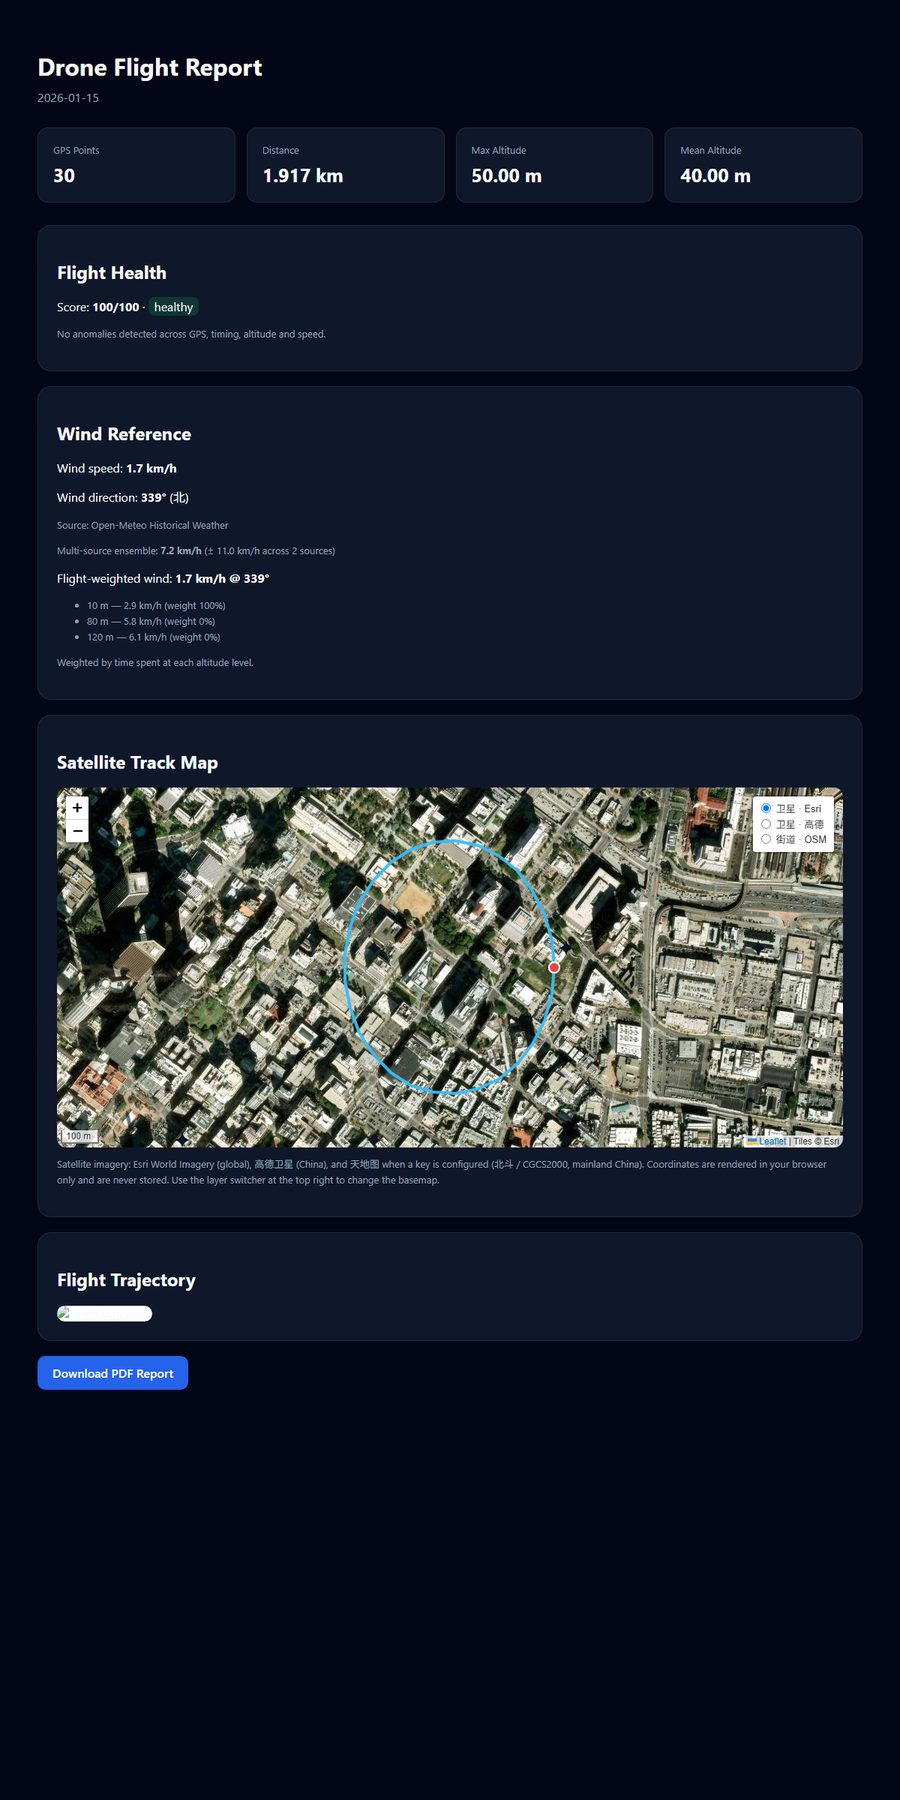
Synthetic demo data. Your own report will use the coordinates, altitude and timing from your log.
What each section shows
- Satellite track map: the flight path on real imagery, with start and end markers and switchable basemaps.
- Summary statistics: GPS points, distance, maximum and mean altitude.
- Flight health: a 0-100 score with plain-language flags for GPS, timing, altitude and speed anomalies.
- Wind reference: regional historical wind, plus the flight-weighted value when altitude data is available.
- PDF report: a downloadable summary you can keep or send to a client.
Ready to try your own log? The analyzer accepts DJI CSV/TXT, ArduPilot .bin and PX4 .ulg files.
Analyze a flight log free →